📌 Please note that this article has been deprecated and replaced with a new one that hones in on the new and improved Employee Results Page. Read more here.
The employee results include:
-
Profile Selection
-
Results
-
Indicators
-
Improvement Areas
Profile Selection
To view employee results you should first select a profile from the relevant drop-down menu. Additionally, the employee information is displayed in this section as per the available data parsed in Bryq. By default, the position and department will be always visible.

Finally, three actions are available to perform for an employee:
-
Invite the employee to take an assessment ➡️ Read more here.
-
Print employee results
-
Delete employee ➡️ You can manually delete an employee for any reason i.e. termination etc. When clicking Delete you will be asked to confirm the deletion..
Now let's have a look at the different sections:
Results
This section is an overview of the employee's scores as per the selected profile. It includes the Overall Score, the Cognitive Score, and the Personality Score of the employee as a percentage.

📌 When analyzing assessment results, it is generally helpful to know how each individual's score compares to other people's scores. Knowing whether a score is high, low, or average in comparison to others necessitates the use of a norm group. Norms enable the comparison of an individual's evaluation score to a relevant comparison group. Numerous standard scales could be used to assess individuals, however, 'Sten' scores -which is the abbreviation for ‘Standard Tens’ - are available to enable a common basic language on both aptitude and cognitive tests.
A ‘Sten’ score represents an individual's approximate position compared to the norm group, thus, other people in that group. So, the placement of the marker indicates where the candidate stands compared to the norm group. ‘Sten’ scores range from 1 to 10, whereas ‘Stens’ 4 and 7 are typical scores obtained by approximately 50% of the norm group. Sten 1 and 10 are extreme scores each obtained by approximately 2% of the norm group.
In Bryq, the responses are compared with those of a group of individuals, who have already taken the assessment. Then, the results are returned as ‘Sten’ scores.
Bryq’s ‘Sten’ classification is presented below:
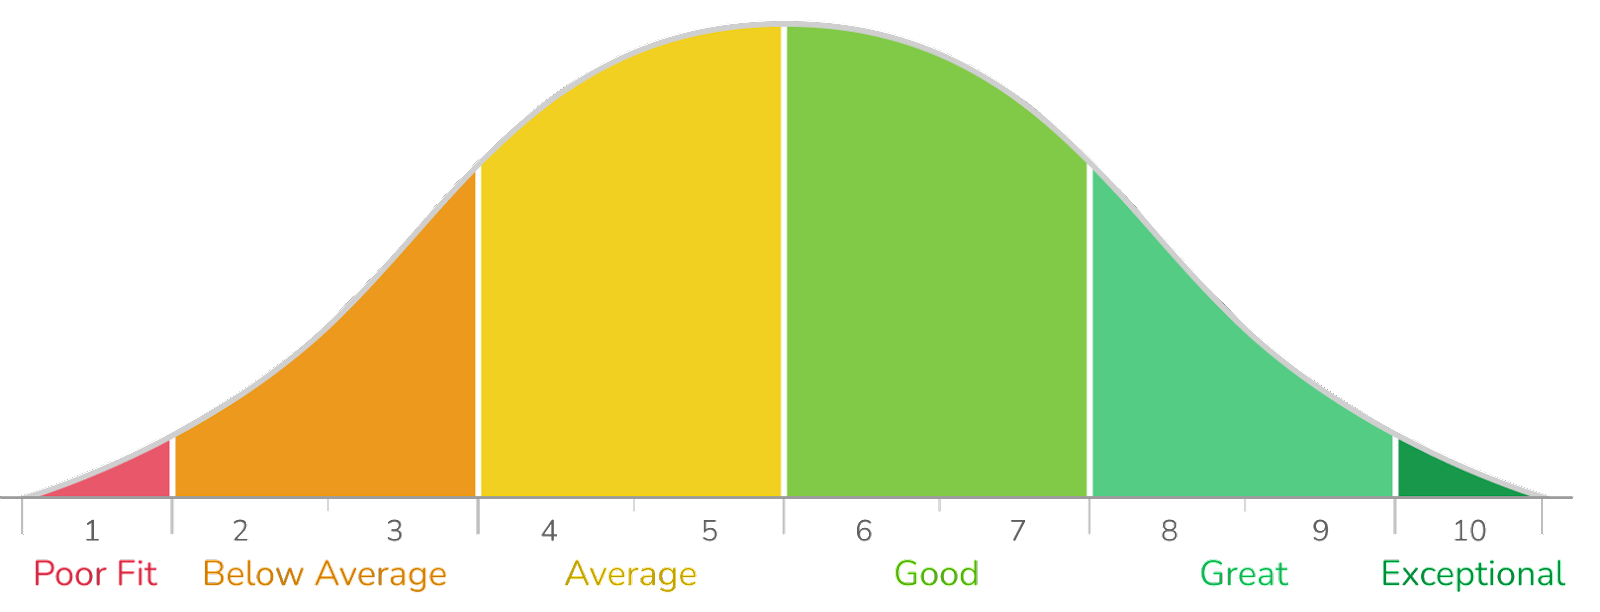
Do note that you should use the ‘Sten’ score comparatively, not absolutely. No score is good or bad in itself, thus, it is advised to use them to find the best match from a specific pool.
The Cognitive Match Score
The chart below shows the candidate's cognitive ability score in each one of the 4 cognitive skills.
-
The size of each wedge in the pie corresponds to the weight that the specific cognitive skill has in the overall cognitive score. In the column Weight, you can see the weight that is assigned to each of the 4 cognitive skills.
-
In the column Score, you can see the employee score on each of the 4 cognitive skills.

📌Note that all cognitive assessments are calibrated and the scores follow a normal distribution. This means that 50% of the candidates will score between 31% and 67% (1 standard deviation from the mean of 49%).
The Personality Match Score
Bryq's personality assessment (based on the 16 Personality Factors framework- see here) will assess the candidates' personality in 16 discrete dimensions to determine his/her personality match for the specific job role.
Below you can see the employee scores on each of the 4 categories:
-
Workstyle
-
Social skills
-
Personality
-
Teamwork

Each of the 4 categories include a number of traits that reflect an individual's personality match in each of the categories. By clicking on the Expand button you can have a detailed view of the traits that comprise each category, as well as the individual score on each of the traits.
For the traits that are of importance to the specific job role, you can see the score of the individual on each of the traits of interest as a percentage. Each trait has two ends (e.g. Cooperative - Assertive, in terms of the candidate's Dominance trait).
The location of the arrow (to the left or to the right) reveals if the employee has scored toward the one pole or the opposite pole. If one of the poles of each specific trait is considered important for the specific role, the pole will be coloured in blue.

After clicking on the Expand button you might also notice that some of the traits are grayed out. While all 16 personality dimensions are measured, usually only 8-10 of them will be relevant to an individual's performance in a specific role. When a dimension is not important, the rectangle indicator will be gray (as shown below).

Indicators
Depending on whether the selected profile is associated with one or more indicators you will be able to see in that section the individual scores for the profile-specific indicators. If you select an optimize profile by default all indicators will appear.
Indicators include Communication, Emotional Intelligence, Problem Solving/Complex Thinking, Sales & Customer Service, Learning Agility, Resilience, Culture, Remote Working, and more.


Improvement areas
For every employee, Bryq provides personalized improvement areas based on the employee's weaker personality traits as per the selected profile. This way you will be able to use these recommendations to understand in which areas your people will need further improvement and create a customizable development path to increase job performance & grow your employees. Learn more here.